 Owncast now supports custom plugins.
 Stream performance
Overall stream health
There’s no point streaming if nobody is able to watch it. The Stream Performance page in the admin, at /admin/stream-health, gives you an overview of some important metrics that may give you an idea if what you’re offering your viewers is leading to a good experience.
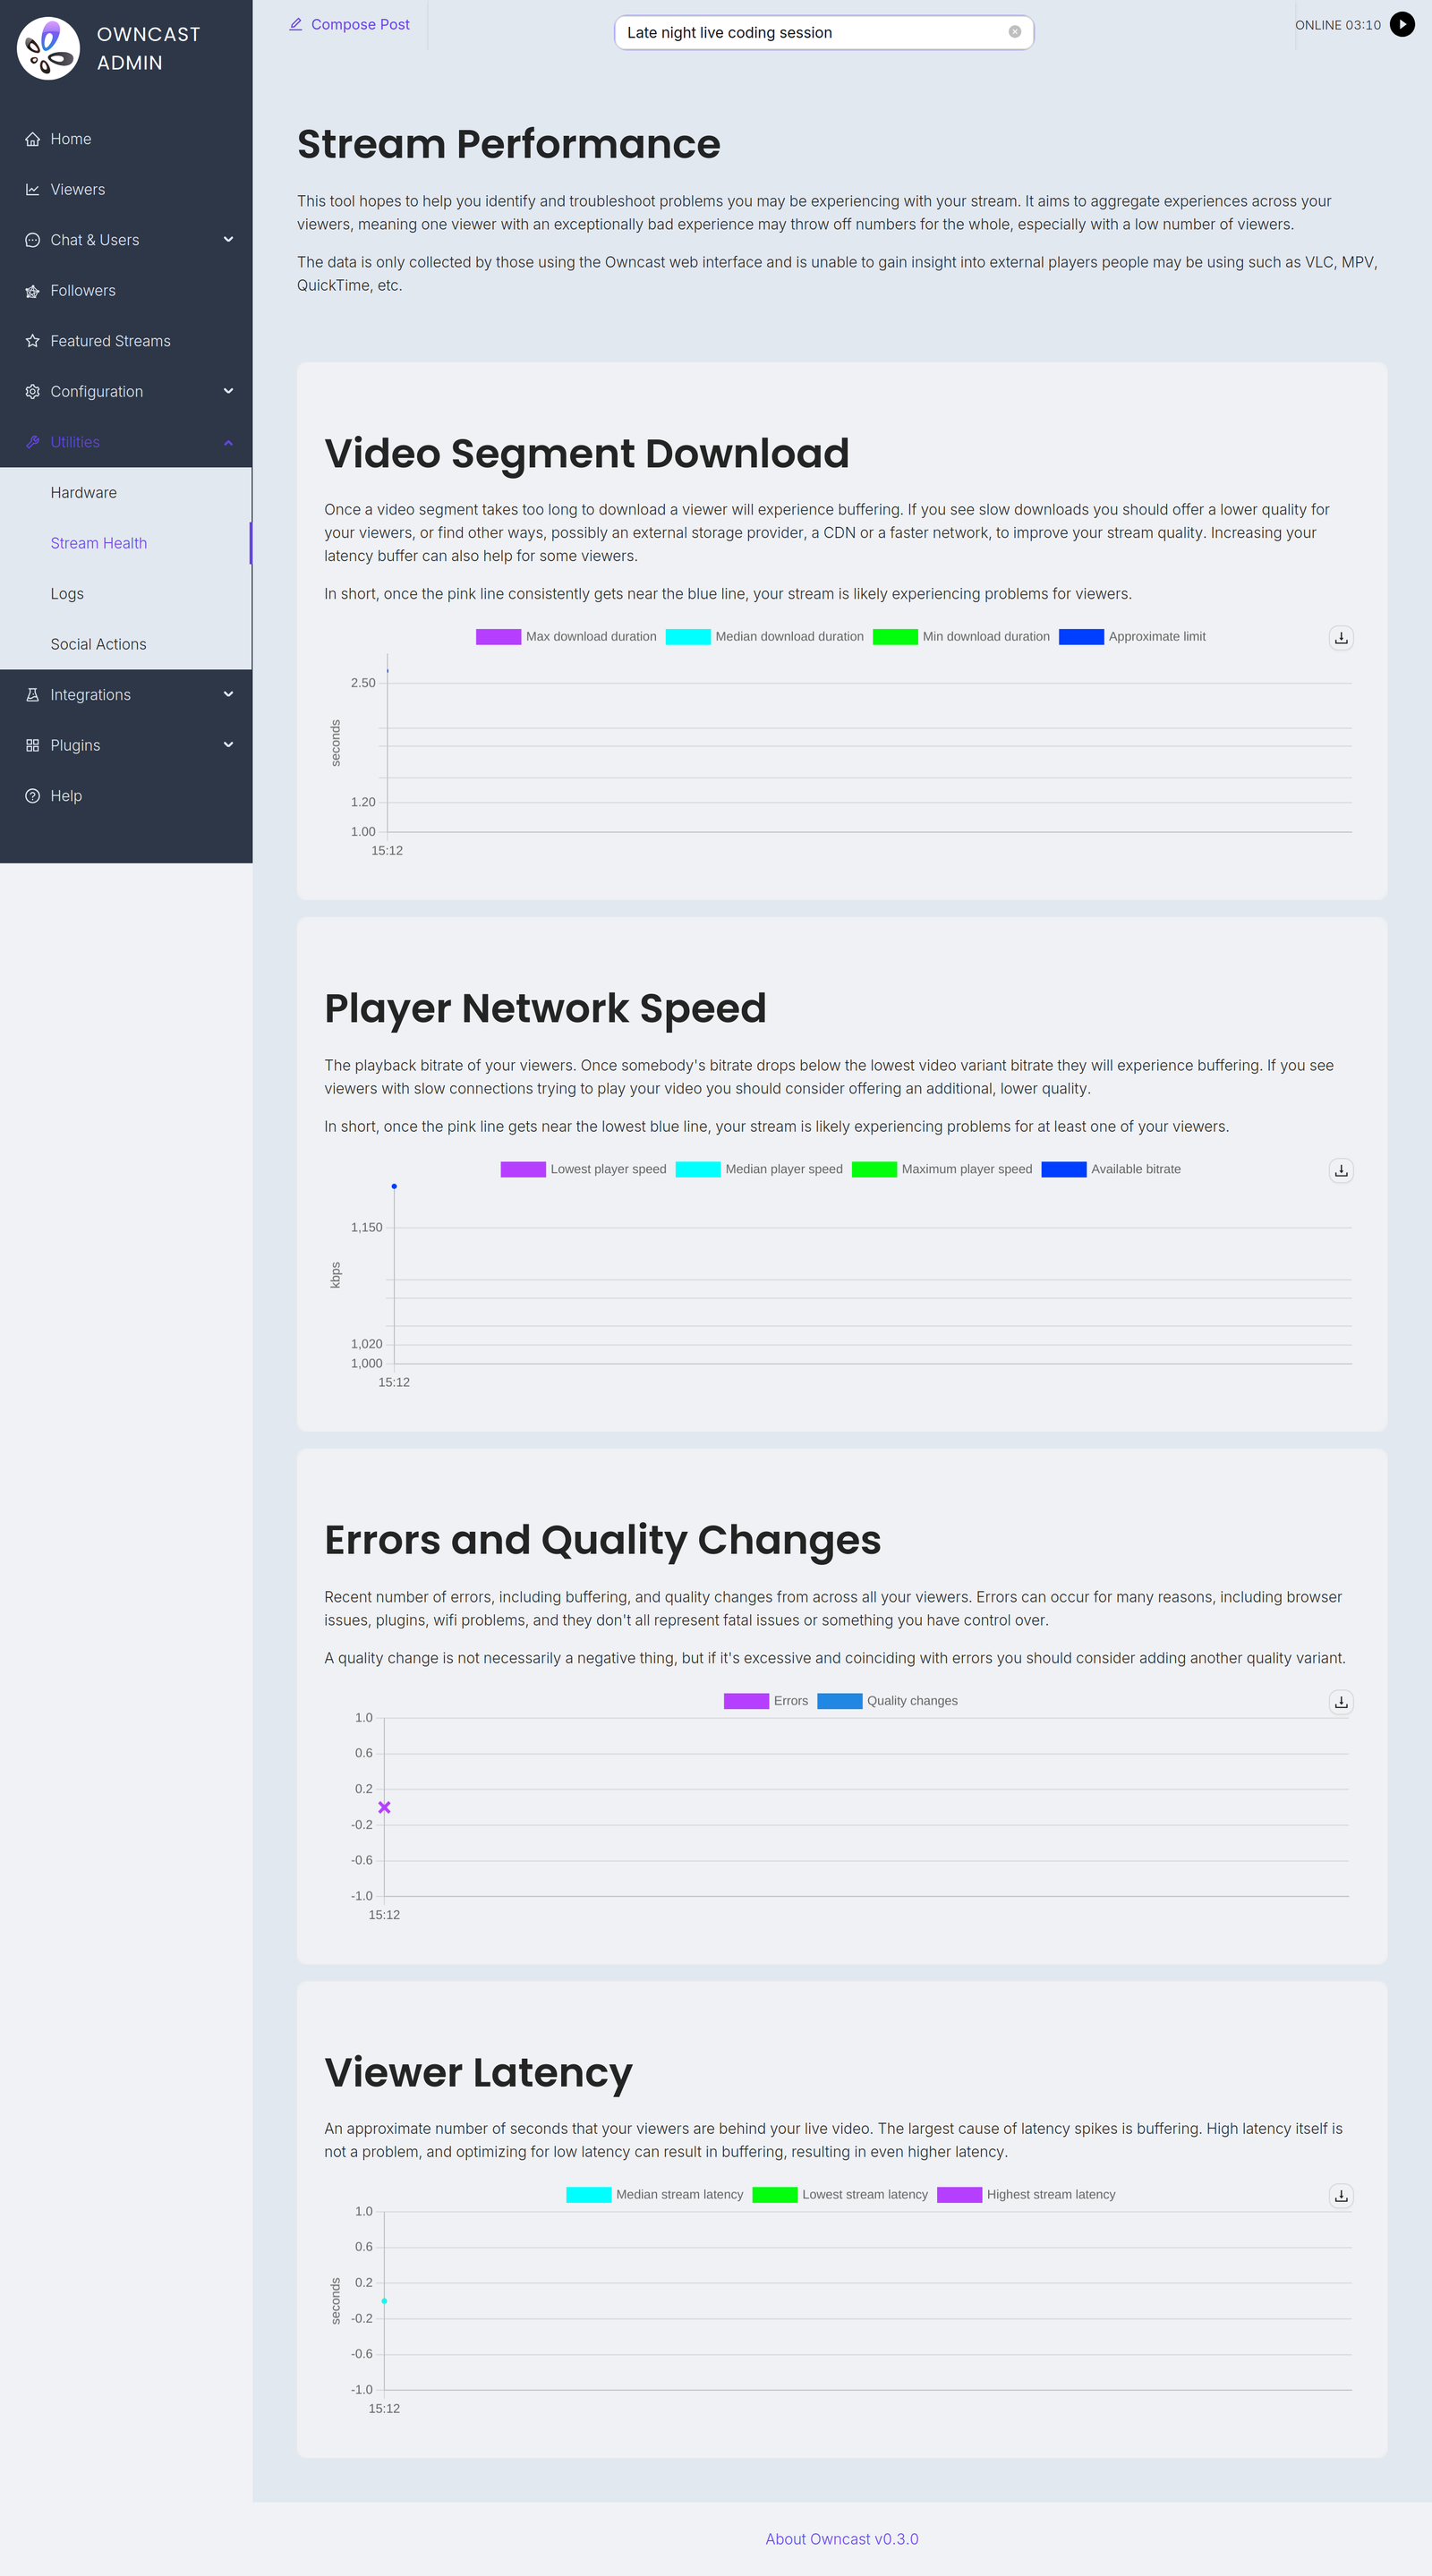
The page charts four things: Video Segment Download, Player Network Speed, Errors and Quality Changes, and Viewer Latency.
Seeing errors, low network speeds, and excessive download times for your content may mean you need to add additional video qualities to improve the playback performance for lower bandwidth viewers, mobile networks, or other factors.
If you're seeing on this page that people are experiencing issues playing back your stream, you may wish to troubleshoot.
Note: Only some players report detailed playback metrics themselves, mostly web browsers running the Owncast web interface.
For players that do not self-report, such as VLC, mpv, Safari and ffmpeg, Owncast records the download speed and duration of video segments it serves, as observed by the server. This only works when Owncast serves the video itself. If your segments are hosted on S3 storage, viewers download them from there and these players are not represented in the metrics.
Hardware
Knowing how your CPU, in particular, is keeping up with the video processing tasks is important when troubleshooting. Owncast gives you a high level overview of key hardware metrics to help with this.
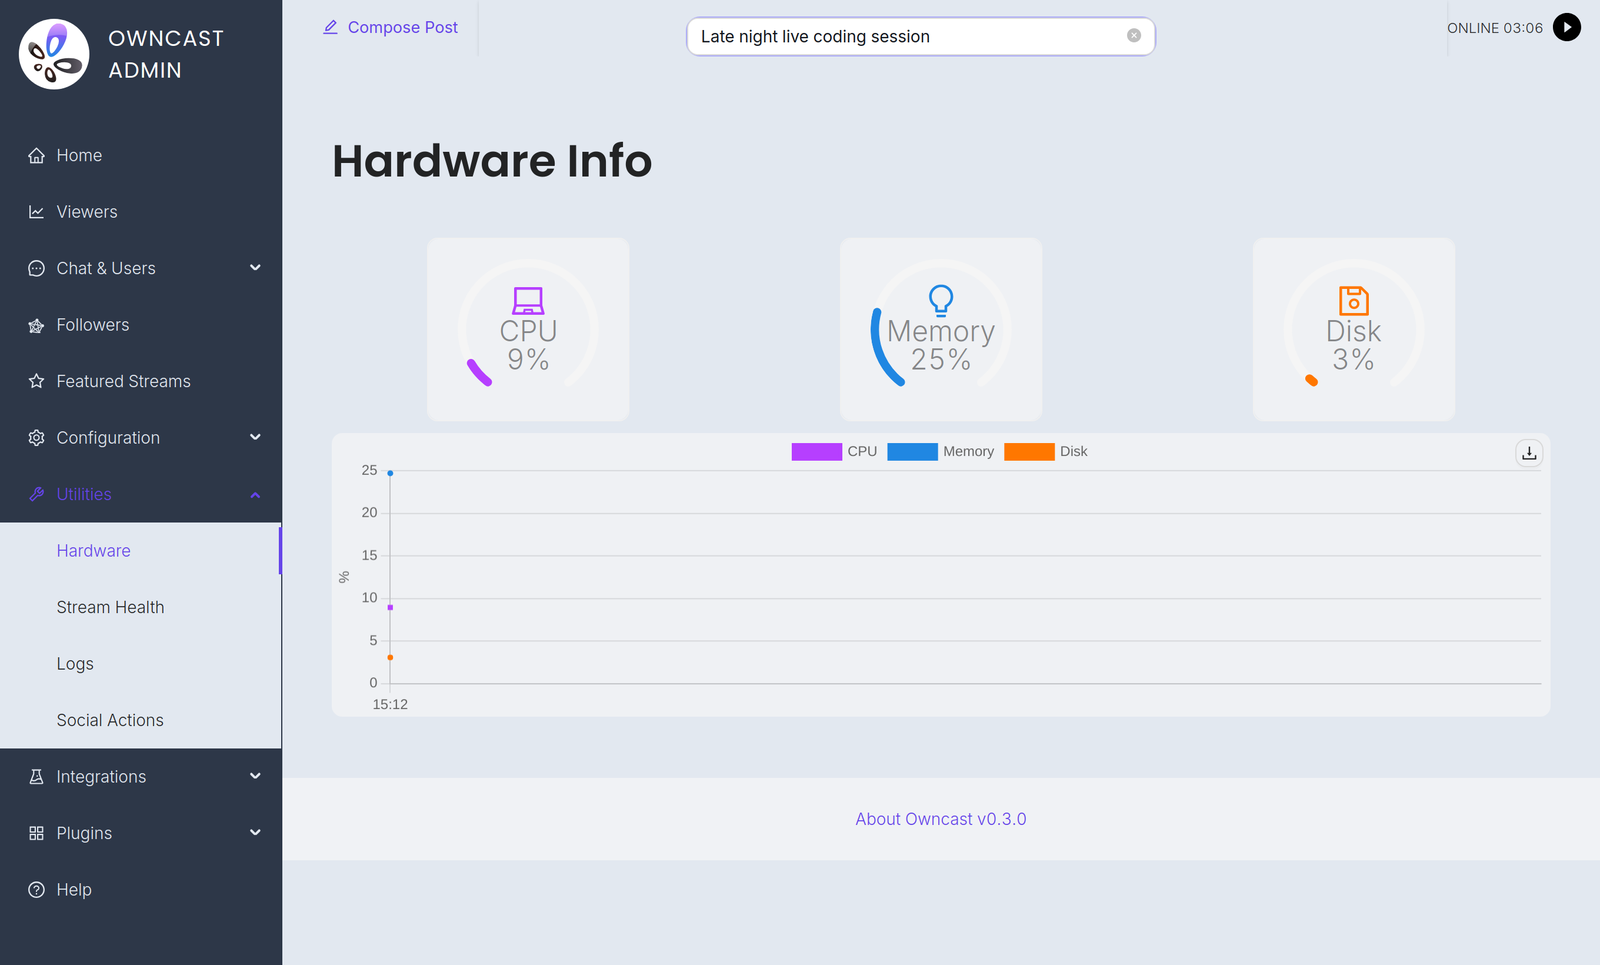
If you see your hardware is being over utilized, you may wish to troubleshoot.
Prometheus
For people who prefer to use external monitoring solutions, Owncast supports using Prometheus to collect a set of metrics.
You can point your Prometheus config at your Owncast instance with the endpoint of /api/admin/prometheus, using basic auth and the admin login data.
For example:
- job_name: owncast
  scrape_interval: 1m
  metrics_path: /api/admin/prometheus
  scheme: https
  basic_auth:
    username: admin
    password: my_admin_password
  static_configs:
    - targets: ["my.owncast.server"]
Exported metrics
All series are gauges, and all carry two constant labels: version (the Owncast version) and host (your configured server URL, or unknown if it isn't set).
| Name | Meaning |
|---|---|
owncast_instance_active_viewer_count | The number of current viewers. |
owncast_instance_active_chat_client_count | The number of connected chat clients. |
owncast_instance_total_chat_users | The total number of chat users on this Owncast instance. |
owncast_instance_current_chat_message_count | The number of chat messages currently saved before cleanup. |
owncast_instance_playback_error_count | Errors reported by players within the current collection window. |
owncast_instance_cpu_usage | CPU usage as seen internally by Owncast. |
Owncast refreshes these values every 2 minutes, so scraping more frequently than that won't give you more resolution.
Improve this page
See something missing or incorrect? Edit this page and improve the documentation for everyone.
 Gabe Kangas
Related Documents
- Video quality and performanceHow broadcasting software, video settings, object storage, latency, and metrics combine to shape your stream.
- Configure Your Stream Key and First StreamLearn how to login, change your stream key, and start your first stream with Owncast.
- ConfigurationConfiguration is generally done through the Owncast administration page located on your server under `/admin`, however, there are a number of runtime flags you can set when starting Owncast to modify its behavior.
- Content Delivery Networks (CDNs)A CDN can help improve the network performance of your Owncast instance by caching and distributing content from servers located closer to users.
- Compatible hardwareVarious pieces of hardware have been tested with Owncast.
- Hardware Accelerated Encoding & CodecsIf you have direct access to specific hardware you may be able to increase the performance of your server by using a compatible codec.